Our platform is like a virtual lab for your eye tracking studies. It offers the possibility to create, conduct, and analyze studies, as well as the effortless participation in your studies from anywhere and with any device equipped with a webcam.
Eyezag’s eye tracking platform
The virtual lab
Visualizations
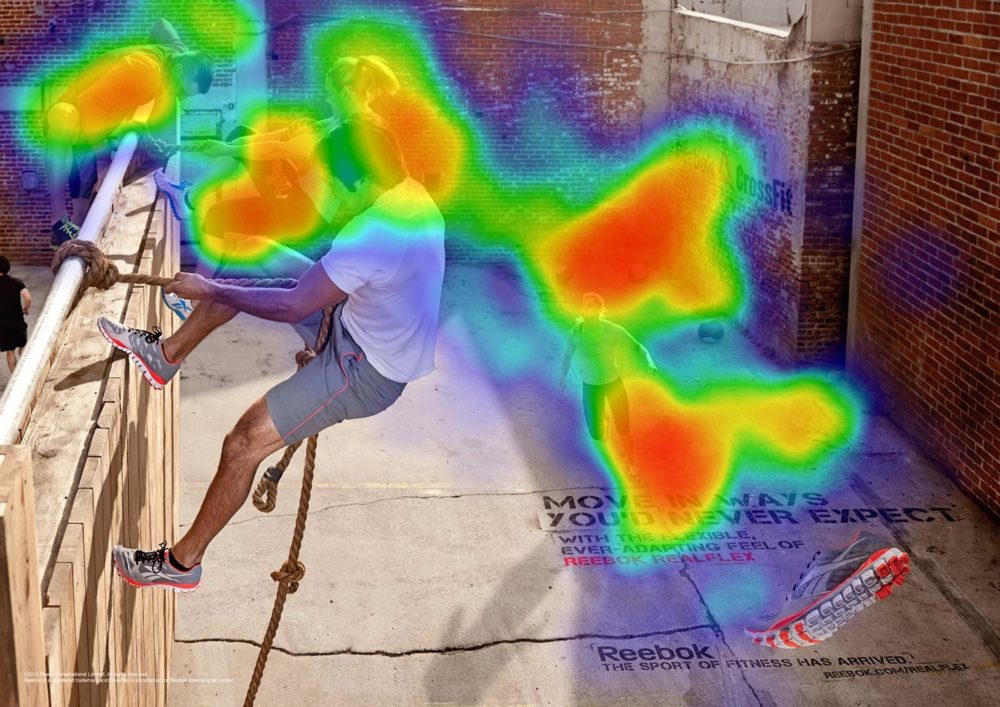
Heat map
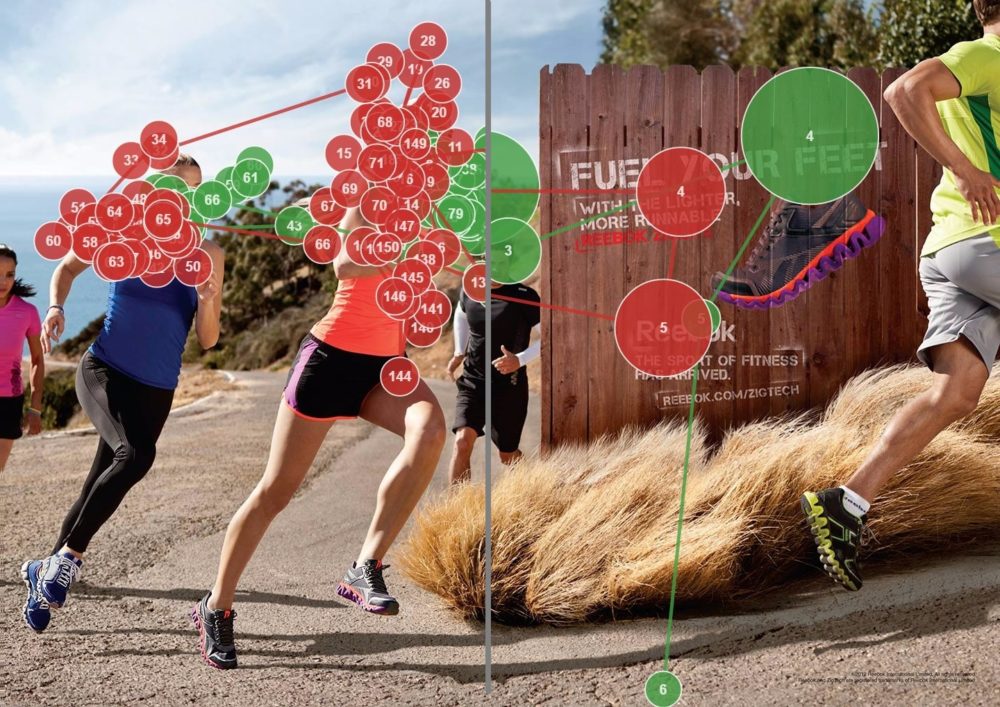
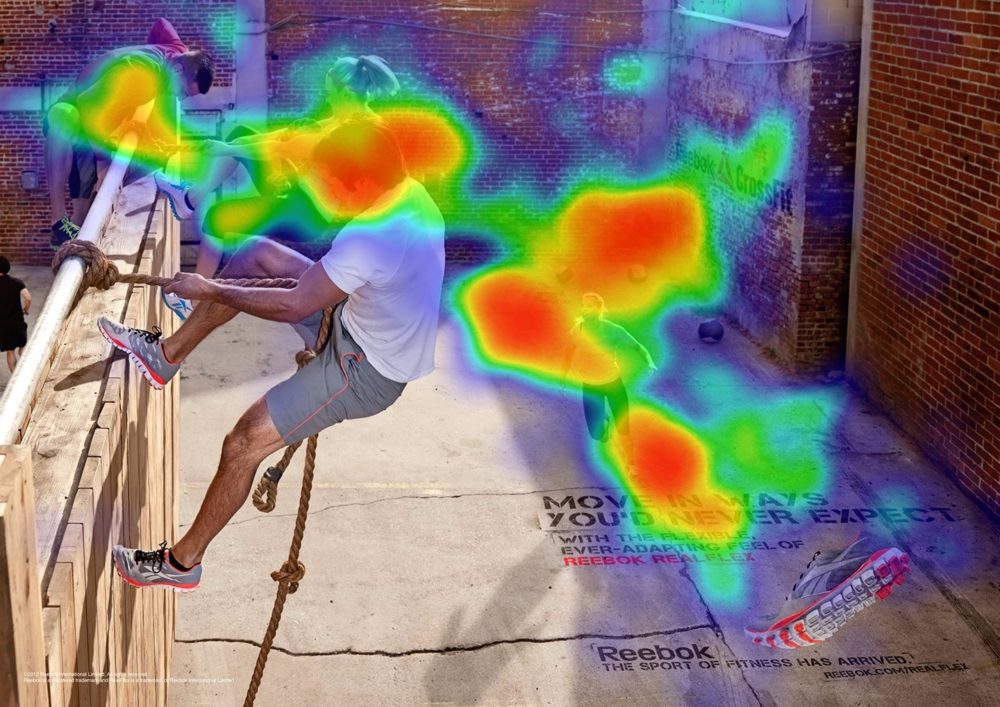
The heat map is probably the best-known representation of eye tracking data. The redder an area is, the more attention it gained. A heat map is especially suitable for the aggregated view of multiple recordings.

Opacity map
The opacity map is the counterpart of the heat map. The opacity map visualizes what was seen or not seen.
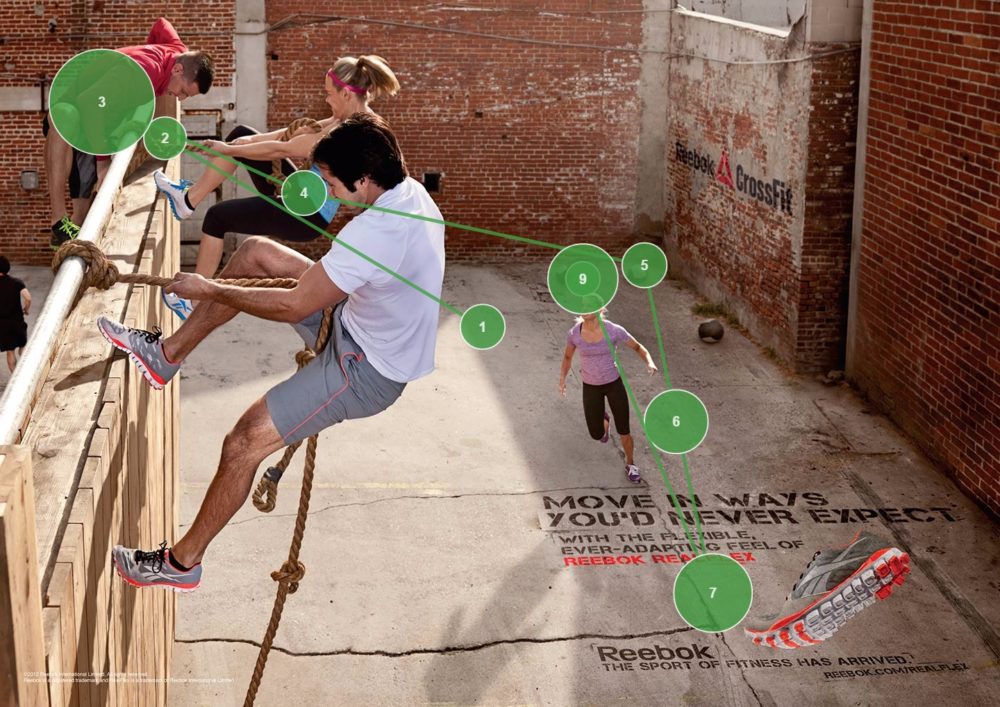
Gaze plots
A gaze plot especially assists in a qualitative analysis of separate tracks. In comparison to a heat map, the gaze plot also illustrates the viewing order of fixations. The size of a particular gaze point indicates the duration of the fixation.
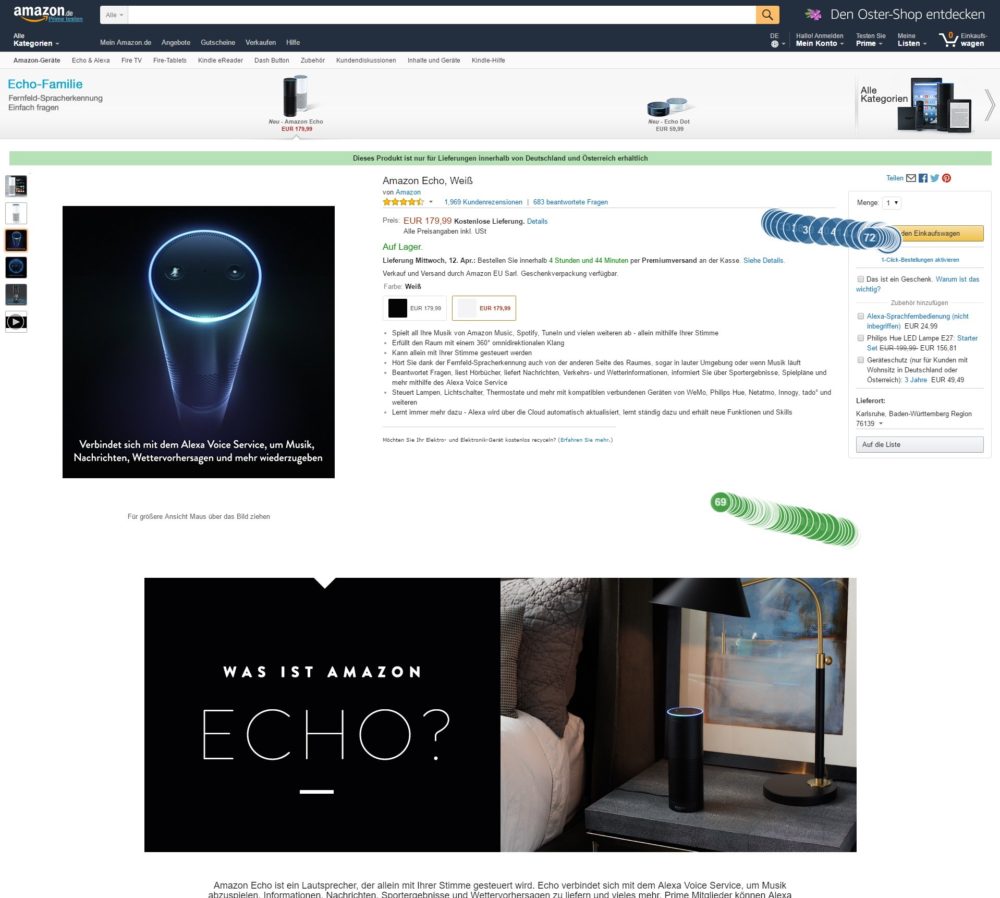
Mouse plot
Besides the eyes our tool also records mouse positions. Therefore, you can draw connections between viewing patterns and conscious user interactions.
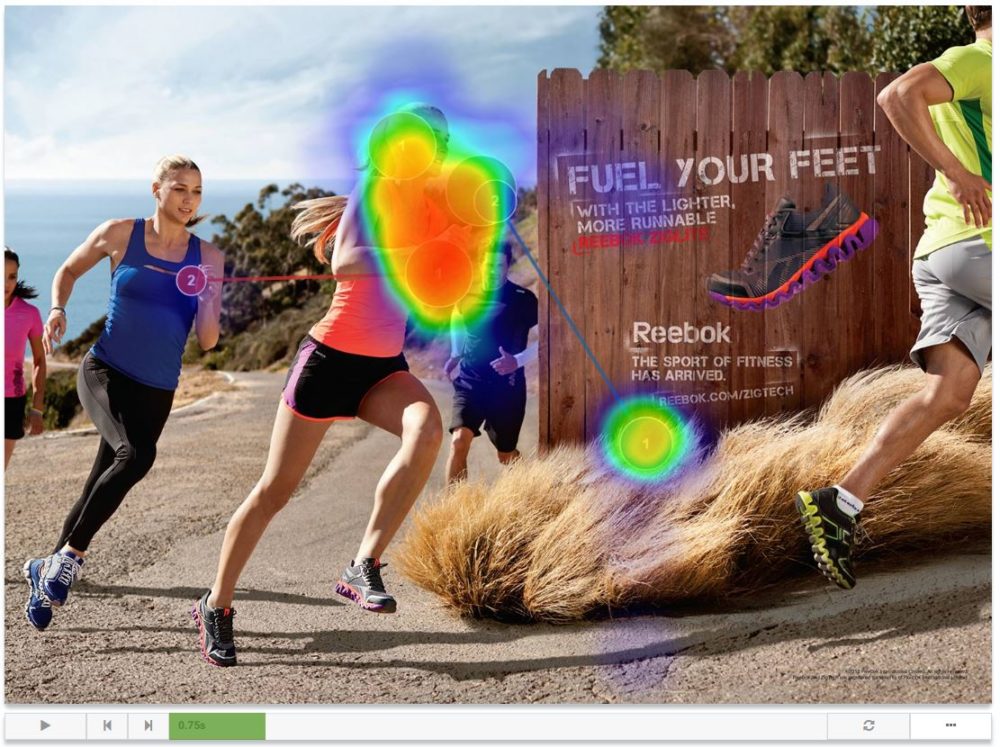
Playback
With the playback functionality you can follow participants on their viewing path and examine points in time over a specified time window. Each available visualization supports playback.
Statistics and data processing
Clustering
Clustering merges spatially and temporally close gaze points to fixations. Thereby, every data track is clustered separately. In the expert options you can adapt the clustering parameters according to your preferences.
Areas of Interest (AOI)
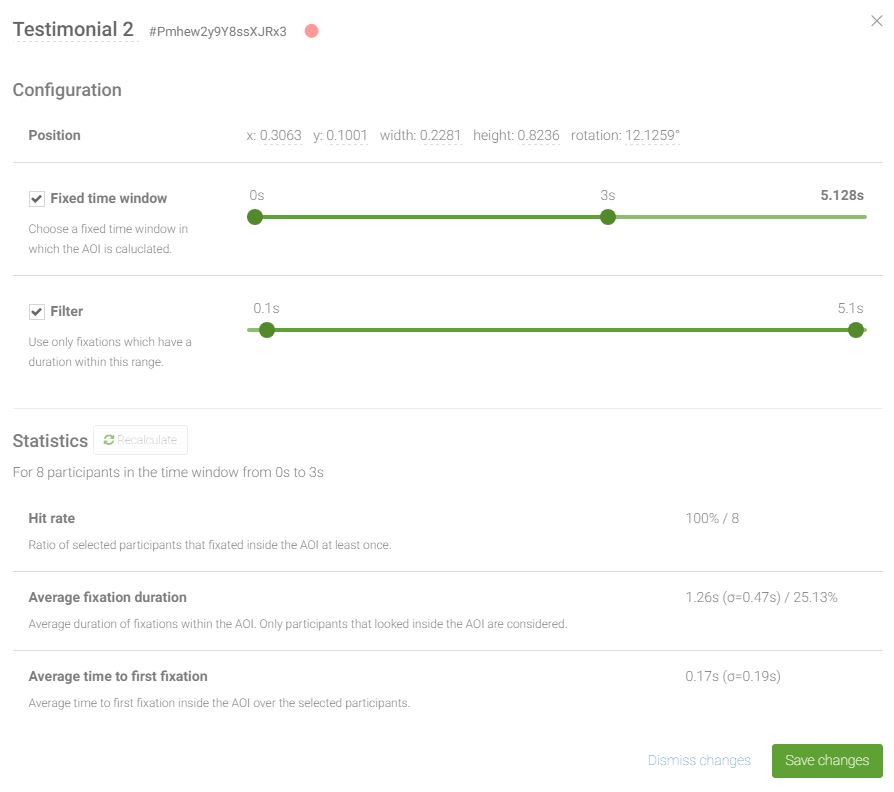
Besides a merely visual representation, eye tracking also gives you statistical data. To gather these data you define areas of interest (AOIs) in which different metrics are collected. You can freely move and adapt the AOIs on our platform and do not need to specify them beforehand.

Hit rate
The hit rate describes the amount of participants looking inside the area of interest. You can specify thresholds so that, e.g., only fixations longer than 300 milliseconds are counted.
Time to first fixation
The acronym TTFF abbreviates the „time to first fixation“. This is the average time until a participant entered an area of interest for the first time. Like with the hit rate, you can define thresholds to specify which fixations get counted.

Fixation duration
The fixation duration describes the overall length of fixations within the area of interest (incl. revisits). This gives information about whether the viewing duration was long enough to perceive the content, e.g., if a text was read.

Mouse data
Each collected statistics from above is also calculated for the mouse data. Therefore, you can see if and how long the mouse was inside an area of interest.

Want to learn more?
Rapid studies
Conduct your studies at record speed. Within minutes you can create a participation link and send it out to your users.
No installation
Neither you nor your participants need to install software. With the online platform you can explore and analyze your data as well as present your results from any device.
Recruiting and participation
Requirements
The participants of your study do not need to install any extra software. Our eye tracking app entirely runs in the web browser without additional risky plugins like Flash.
The only hardware requirement is a webcam with at least 640×480 pixels, as well as the Chrome browser (which is one of the most popular browsers worldwide).

Platform recruiting
You want to fully concentrate on the conceptual design and analysis of your study and spend no time with participant recruitment? Great! You can easily book your target group through the platform and we take care of the rest.
We work together with high-quality national and international panels to quickly provide your survey with the required target group.
Participation link
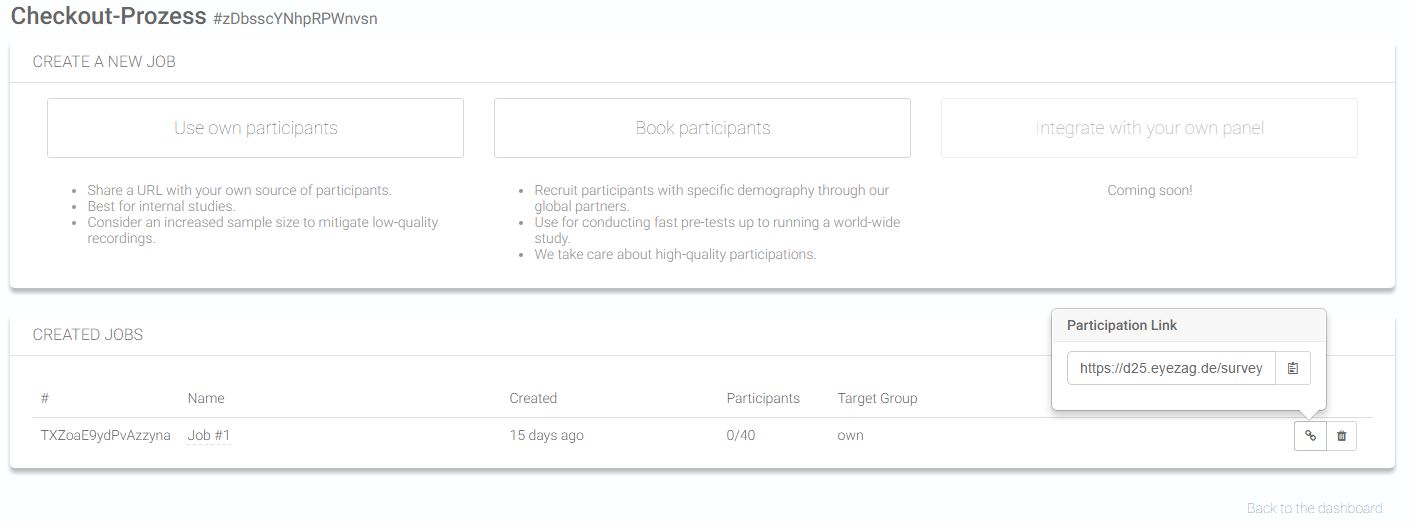
If you already got a pool of participants, the survey runs in-house, or you want to recruit participants via social media channels – with few clicks you can create a participation link to send out to your users.

Panel integration
Also, if you already got a panel service to your needs or an own pool of participants, you can integrate them seamlessly to you survey. We are happy to help you with the set-up!
Screening
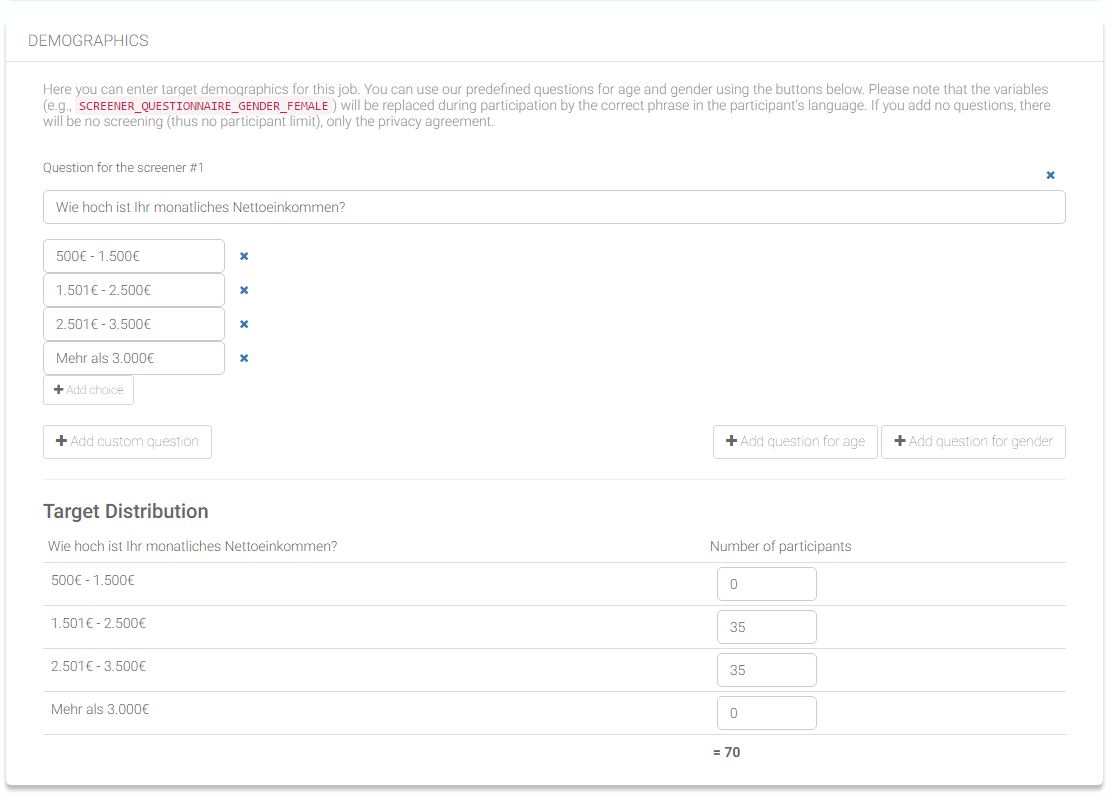
Besides technical screening which automatically checks if a user complies with the requirements to participate in a study, you can add individual screening questions and thereby define the target demographics.

Quality assurance
To assure a good quality of the eye tracking data, we added a second calibration at the end of the recording. Based on the deviation to the first calibration we can calculate a quality score for the eye tracking and are able to remove bad quality recordings.
Instructions, questionnaires, and integration
Questionnaires
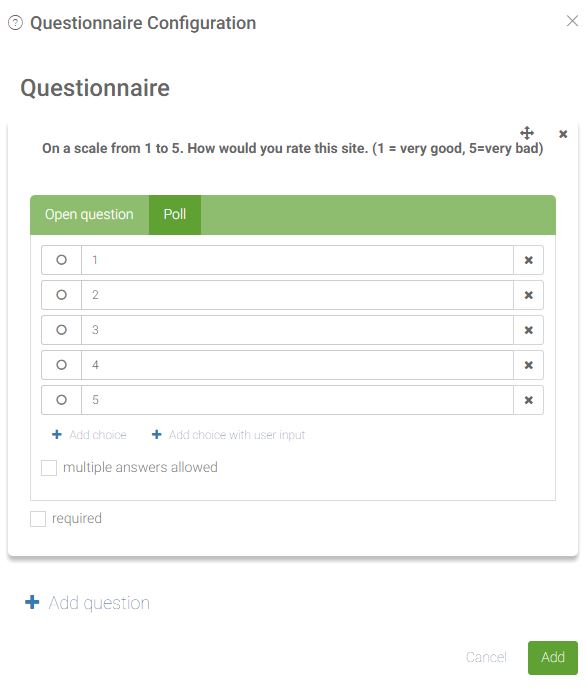
You can of course add questions to your survey. This allows you during the analysis to select participants based on given answers. Also, you can download the questionnaire results for further processing in SPSS, Excel, or any tool of your choice.
Instructions
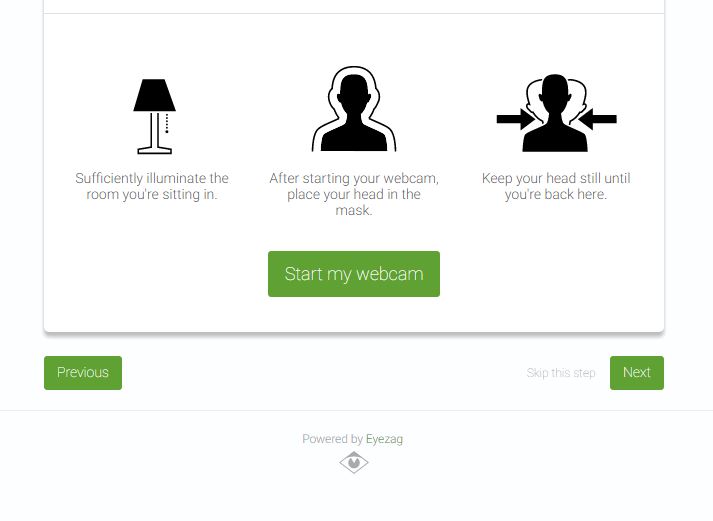
You might add blocks of text in your survey to instruct your participants and, e.g., give a task. The webcam recording is separately instructed, so that participants look after an adequate illumination and a still head position.

External tools
You are free to use the questionnaire tools of your choice (like SurveyMonkey or Questback). Also, further external tools can seamlessly be integrated using incoming and outgoing links.

Data export
Images
Every possible visualization – specified by selected participants, visualization parameters, and a specified time window – can be downloaded as image.
Animations
Similarly to the image download you can export selected visualizations as video within a specified time window.

AOI data
All measured data within an area of interest can be downloaded as CSV file.

Gaze data
You can download the eye tracking data as a CSV file with x- and y-coordinates as well as timestamps.

Questionnaires
Questionnaires and the given answers can be downloaded as CSV file for you to further process it in SPSS, Excel or any software of your choice.


